J Curve Phenomenon
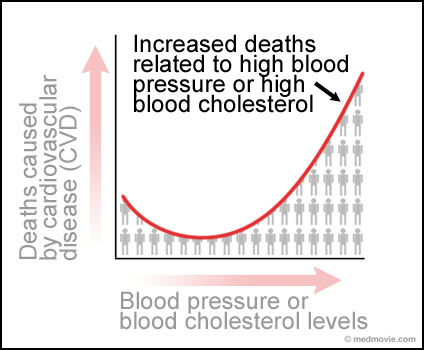
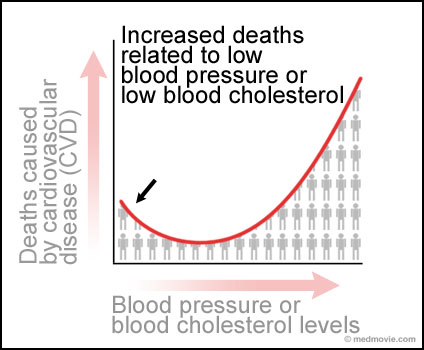
When the blood pressure or blood cholesterol levels of large groups of people are plotted on a graph against risk of death from cardiovascular disease (CVD), it often results in a J-shaped curve. This curve shows that those with higher blood pressure and/or cholesterol levels, closer to the top of the curve, are more likely to die from CVD. The curve also shows that those at the lowest end of the curve (with very low blood pressure and/or low cholesterol levels) also have higher CVD mortality. This accounts for the J shape and is known as the J-curve phenomenon. Most evidence, however, indicates that individuals at the bottom-left part of the curve (with very low blood pressure and low cholesterol levels) tend to be different from the general population in other ways. Those differences may contribute to the apparent increase in mortality. The notion that effectively lowering blood pressure or cholesterol levels may be harmful is unfounded and shouldn’t influence clinical practice. The American Heart Association continues to encourage people to follow national guidelines and their healthcare professional’s advice in treating high blood pressure and high blood cholesterol.
Visit Medmovie.com Website for more information.